You might be struggling with spotting a golden cross stock out of a long list of stocks. In this article, we will learn how to identify stocks with golden crossovers. You do not have to struggle after reading this complete guide on golden crossovers.
How to Identify Golden Crossover Stocks?
Golden cross stock screening strategy – identifying the right stock at the right time is the key to successful stocktrading or investing. Every day, investors or traders are looking for stocks that can give good returns. In the world of stock trading and investing, spotting opportunities can be a key driver of success for momentum investing. Many stock indicators can tell you which stock to invest or trade. I have tried a few indicators but most of the time I failed to achieve the desired result. Finally, I have one strategy that is working for me.
One of the most widely recognized and relied upon opportunities is the “Golden Cross.” It’s a term that gets thrown around in trading circles, and for good reason. The Golden Cross is a technical indicator that signals a potential uptrend in a stock’s price. In this article, we’ll dive deep into what the Golden Cross is, how it works, and most importantly, how you can spot opportunities when it occurs.
Table of Contents
What is a Golden Cross?
The Golden Cross is a bullish signal generated on a stock’s price chart when a short-term moving average crosses above a long-term moving average. Typically, it involves a 50-day simple moving average (SMA) crossing above a 200-day SMA. This event indicates a shift in market sentiment from bearish to bullish and suggests the potential for a sustained upward price trend.
Why is the Golden Cross Important in stock trading or investing?
Like moving average indicators, the Golden Cross is an essential indicator for traders and investors. This indicator provides a clear, visual confirmation of a bullish trend. When these two moving averages cross, it reflects not only short-term momentum but also long-term strength. Here are a few pointers to support this hypothesis.
- Trend Confirmation: A Golden Cross helps confirm a shift from a bearish trend to a bullish trend both in the short and long term. This gives traders more confidence in their buying positions.
- Long-Term Outlook: This indicates a change in investor sentiment towards the stock for a longer term. The use of long-term moving averages (e.g., 200-day SMA) implies a commitment to the stock’s potential over a more extended period.
- Risk Mitigation: It provides an entry point that is generally considered less risky compared to buying in a bearish market.
However, the golden cross in stock is considered the only breakout from a bearish to bullish trend. You must confirm the breakout with other indicators such as RSI, Super Trend, Trading Volume, and MACD before investing in the stock.
Also Read: 5 must technical indicators to learn for breakout confirmation before investing.
How to Identify Golden Crossover Stocks?
Now that we understand what a Golden Cross is and why it’s significant, let’s explore how to spot opportunities when it occurs:
Before jumping into the technical details, make sure you have a trading account with any one of the SEBI-registered Stock brokers in India. To identify Golden Cross stocks, use any broker’s platform such as Tradingview, Zerodha, or free tools chart link and screener.
- Identify the Moving Averages: First, you need to have access to a price chart of the stock in any of your broker’s platforms or using free platforms like Yahoo Finance etc. Plot both the 50-day and 200-day simple moving averages. This is one of the important steps in Spotting Golden Cross stock.
- Look for the Cross: Pay close attention to the point where the 50-day moving average crosses above the 200-day moving average. This is the Golden Cross. This can happen when a 50-day SMA crosses over a 200-day SMA or a 50-day EMA crosses over a 200-day EMA. However, technically crossing of simple moving average (SMA) lines is considered a golden cross.
- Volume Confirmation: It’s often beneficial to see if there is an increase in trading volume around the time of the Golden Cross. Higher volume can validate the strength of the bullish signal. Also, look for volumes BARs that are in green. If the trading volumes are above the 100-day moving average for the last couple of days it is a strong confirmation.
- Other Supporting Indicators for Bullish Confirmation: Consider using other technical indicators such as the Relative Strength Index (RSI) or Moving Average Convergence Divergence (MACD) to further support your decision. I consider RSI (14) above 50 and MACD signals to cross over the line as bullish signals. RSI is most important for a trade confirmation. Look at these indicators on a daily chart.
- Fundamental Analysis: Don’t rely solely on technical indicators. It’s essential to conduct a fundamental analysis of the stock and the company behind it. Look at financial statements, news, and industry trends if you are a long-term investor. Piotroski score > 7 is one of the best indicators for a fundamental analysis. You can get this score in the screener.in
- Risk Management: Before making any trade, have a clear risk management plan in place. Determine your stop-loss level and take-profit target. Consider investing your own money without any leverage.
Case Studies: Real-World Golden Cross Success Stories
To illustrate the power of the Golden Cross, let’s take a look at a couple of real-world Golden Cross Success Stories:
Va Tech Wabag Ltd. (WABAG): Golden Cross Success Stories
On November 14, 2022, Wabag’s stock experienced a Golden Cross at 272 level. The stock’s price climbed steadily in the following months, eventually leading to significant gains to reach at 542 level on 1st August 2023, before it gave a correction. The stock doubled in about one year after the Golden Cross. Look at the chart below RSI (14) was above 60 and the trading volumes were also strong.

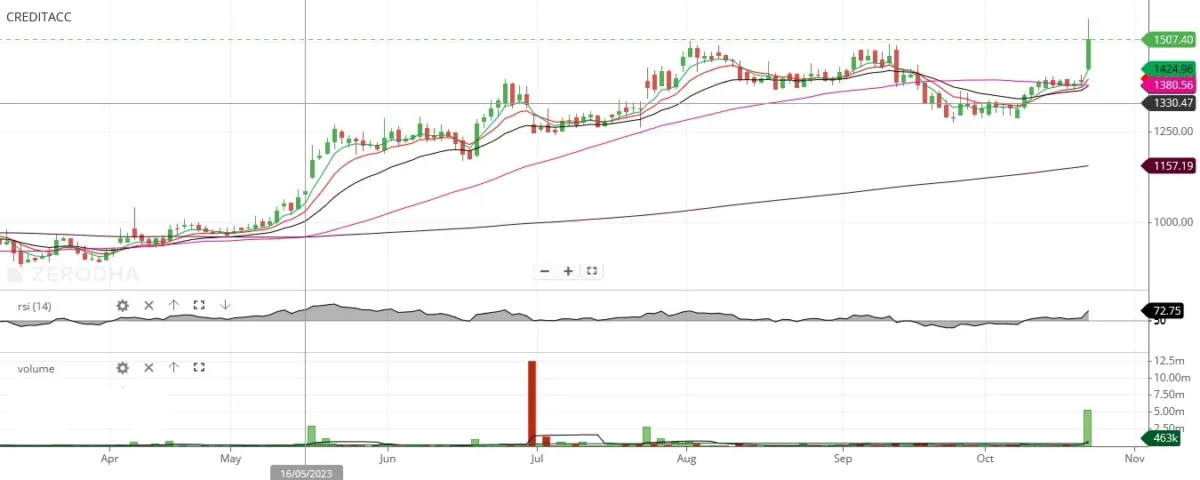
CreditAccess Grameen Ltd. (CREDITACC): Golden Cross Success Stories
CreditAccess Grameen Ltd. showed a Golden Cross signal in May 2023 at the price level of 1116. The stock experienced a substantial uptrend over the subsequent year to reach the 1500 level in October 2023. There is still the potential to reach the 1800 level within a short period. This is again one of the best stocks with golden cross.
Bombay Stock Exchange (BSE): Golden Cross Success Stories
BSE Ltd. formed a Golden Crossover in June 2023 at the price level of 671 with confirmation from RSI and trading volume. The stock experienced a substantial uptrend over the period to reach 1700 level in October 2023. There is still the potential to reach the 1800 level within a short period. This is one of the best stocks with golden cross.

Bottom lines
Spotting Golden Cross stock opportunities is a valuable skill for traders and investors. It provides a clear and easily recognizable signal of a potential uptrend. However, it’s crucial to remember that no indicator is foolproof, and risk management should always be a priority. Use the Golden Cross as a tool in spotting Golden Cross stock in your trading arsenal, but combine it with other forms of analysis for a well-rounded approach to trading and investing.
However, all the stocks with golden cross does not give good return. Confirm the breakout with other technical indicators before investing.
The above strategy to spot stocks with golden cross works for me. Is it working for you as well? Share your experience in the comment box.
Happy trading!
More Across from our Website
We endeavor to help you to understand different aspects of a company before you invest in the company’s IPO. Learn all company insights for investment in new companies in the Indian share market 2023. To know more information about company insights for investment, business overview of companies for investment, here are some suggested readings on company insights for investment –10 Best IPOs in 2022, Tata Motors Stock Price, Tesla Stock Price Prediction 2025, Highest Dividend paying stocks, 5 best upcoming IPOs in India.
[…] is another concept of golden crossover, where the 50-day SMA crosses over the 200-day SMA. This gives a view of the bullish trend. Other […]